Digital Analytics Dashboard
Helping the Peale Museum track their digital analytics growth through curated dashboards
Role
Research & Design
Team
Iris Sun - R&D
Krishna Kishore Lal - R&D
Timeline
Oct - Dec (2025)
Skills
SEO & Analytics Audit
Dashboard Design
INTRODUCING THE PEALE MUSEUM
The Peale is Baltimore's Community Museum, housed in the first purpose-built museum building in the United States. The museum's mission is to amplify and preserve the voices of Baltimore's diverse communities through storytelling, art, history, and innovation.
THE PEALE'S ASK
Expand their target demographic to include younger audiences
Increase conversions (donations, memberships, volunteering)
Enhance their social media strategy to drive more traffic to their website.
RESEARCH PROCESS
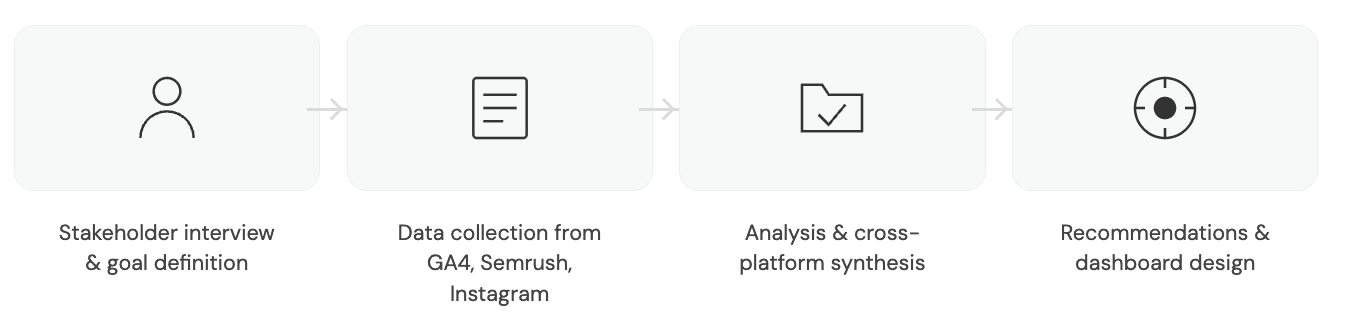
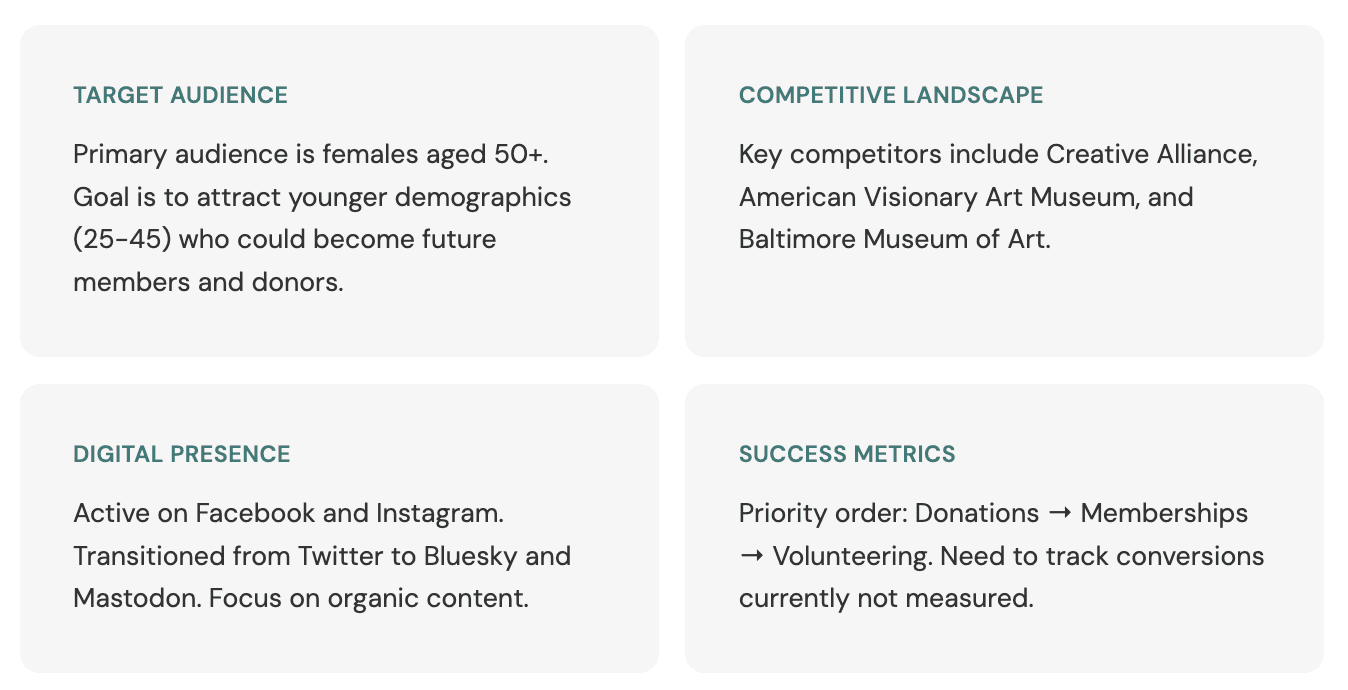
STAKEHOLDER INSIGHTS
Our talk with their team gave us insights on their goals and pain points
DATA COLLECTION SOURCES

APPROACH
So, we analyzed their SEO performance, Google Analytics data, and social media analytics
and devised recommendations to meet their goals
01 SEO Aduit
PAINPOINT 01

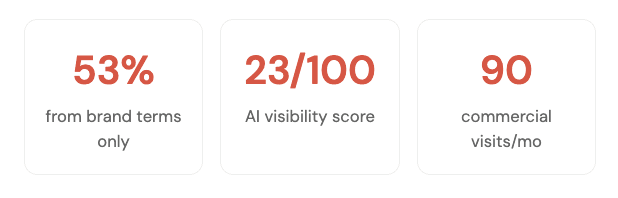
53% of traffic comes from just 2 branded terms so new audiences can't discover The Peale
The Peale ranks for only 465 keywords vs competitors' 1,600-22,000.. Commercial intent keywords (25.2%) drive only 90 visits. AI visibility score is just 23/100—when people ask ChatGPT "What museums should I visit in Baltimore?", The Peale isn't recommended.
RECOMMENDATION 01
Create content for discovery keywords and build AI-friendly structure
"Free Admission Days at The Peale" page → targets "baltimore free"
"The Hidden Art History of Baltimore" blog series → targets "baltimore art"
Add FAQ sections to key pages (AI loves Q&A format)
Get listed on "Things to Do in Baltimore" roundups and travel blogs
Publish 2-4 SEO-optimized blog posts per month; Goal: 465 → 1,000 keywords in 12 months
PAINPOINT 02

138 broken links and 1,063 HTTP issues are blocking user engagement and hurting rankings
Users hit dead ends from broken links, causing frustration and abandonment. HTTP links on HTTPS pages trigger browser security warnings—eroding trust.
RECOMMENDATION 02
Fix broken links, update HTTP references, and add missing page elements
Export broken links from Semrush; fix URL, redirect, or remove each one
Find-and-replace all HTTP links with HTTPS versions
Implement site-wide 301 redirects from HTTP → HTTPS
Add H1 tags to all 117 pages missing them
Request linking sites add descriptive anchor text (e.g., "visit The Peale Museum")
Set up monthly monitoring to catch new broken links
WEB DASHBOARD FOR SEO
So we created a dashboard for tracking SEO

02 Google Analytics
PAINPOINT 01
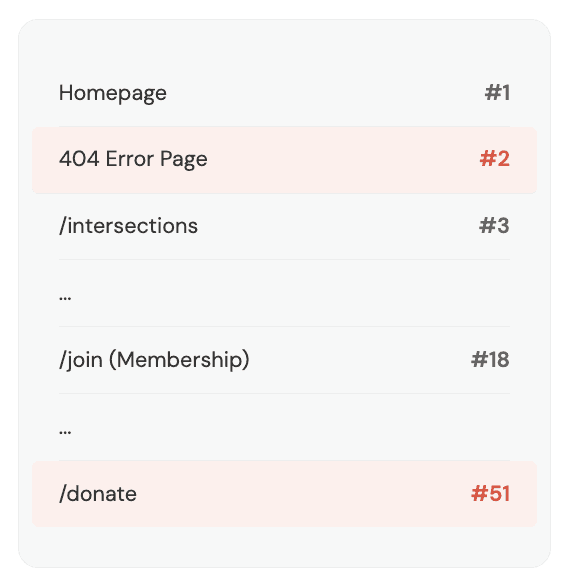
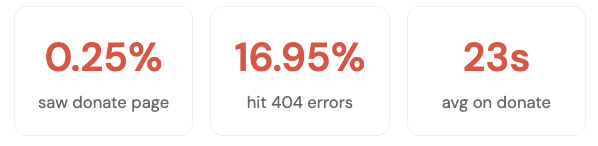
Donation page ranks #51 while 404 errors rank #2, so conversion pages are nearly invisible.
Only 0.25% of visitors see the donation page; 0.79% see membership. The 404 error page (from broken links) gets more traffic than both combined—with just 4 seconds engagement before users leave.
RECOMMENDATION 01
Surface conversion pages in navigation and improve page UX
Add "Donate" and "Become a Member" buttons to homepage hero
Rename "Join Us" to "Become a Member"—clearer call to action
Display membership tiers and pricing upfront; don't hide behind clicks
Use visual hierarchy—highlight price in bold, add testimonials for social proof
PAINPOINT 02
Mobile loads 7.6x slower than recommended, alienating younger audiences who browse on phones.
Desktop dominates at 76% while mobile is only 22%, likely suppressed by poor experience. 53% of mobile users leave if pages take over 3 seconds.
RECOMMENDATION 02
Optimize mobile performance and grow discovery channels
Compress images and CSS/JS files to improve load speed
Enable lazy loading for below-fold content
Conduct mobile UX audit to ensure responsive design works properly
Continue and expand referral campaign—it's working well
Partner with Baltimore tourism sites for more referral traffic
Post social content Thursday-Saturday to match weekend traffic peaks
PAINPOINT 03

The Peale can't measure success: no event tracking for donations, memberships, or purchases.
GA4 tracks 11 basic events but none for actual conversions. Monetization dashboard is completely empty: no revenue, no purchase tracking, no transaction history.
Without measurement, The Peale can't know what's working, test improvements, or demonstrate ROI.
RECOMMENDATION 03
Configure GA4 conversion tracking and connect to monetization dashboard
Set up custom events to track donations, membership signups, volunteer form submissions
Mark these as Key Events (conversions) in GA4
Configure monetization tracking with donation amounts by tier
Track sign-ups within individual, corporate, and category membership plans
Use our proposed dashboards to monitor KPIs monthly
Increase traffic to unlock demographic insights (age, gender, interests)
WEB DASHBOARD FOR GOOGLE ANALYTICS
So we created a dashboard for tracking Google Analytics

03 Social Media: Instagram
PAINPOINT 01

Inconsistent visual branding with confusing Reel covers, some completely black with no topic.
Instagram grid shows different colors, layouts, and typography with no cohesive brand identity. Reel covers are sometimes blank or black—making it unclear what the video is about.
RECOMMENDATION 01
Establish consistent visual branding and create compelling Reel covers
Create templates with consistent brand colors, typography, and layouts
Design Reel covers with simple background, clear topic, never black/blank
Redesign carousel first images to fit Instagram's 3:4 preview ratio
Create recurring Reel series: Gift Ideas, Event Highlights, Behind-the-Scenes
Build on what works: expand holiday and special event content
PAINPOINT 02

Zero calls-to-action driving followers to website
& no connection between social engagement and conversions.
GA4 shows effectively 0 sessions from organic social. Posts announce events but never direct users to the website for tickets, membership, or more info.
RECOMMENDATION 02
Add CTAs to every post and create a strategic content calendar
Add clear CTAs: "Link in bio for tickets," "Visit thepeale.org," "Full info on our website"
Add interaction hooks: "Tag someone who needs to see this," "Tell us your favorite!"
Create seasonal content calendar around holidays, events, Baltimore cultural moments
Publish themed Reels 2-3 weeks before big events to capture early interest
Schedule posts Thursday-Saturday to align with weekend traffic peaks
Track link clicks and website visits from social to measure improvement
WEB DASHBOARD FOR SOCIAL MEDIA
So we created a dashboard for tracking Social Media

CLIENT FEEDBACK

REFLECTIONS & NEXT STEPS
What we learned
This project reinforced the importance of data-driven decision making in UX design. By examining analytics alongside user research, we identified issues that might not have been apparent from heuristic evaluation alone—particularly the disconnect between social media activity and website conversions.
Working with a nonprofit organization also highlighted the constraints of limited resources. Our recommendations prioritized high-impact, low-cost interventions that the small team at The Peale can realistically implement.
Challenges
Limited demographic data in Google Analytics (due to traffic thresholds) meant we couldn't fully analyze the current audience composition. We recommended increasing traffic first to unlock these insights.
The social media analysis was constrained to Instagram due to the newness of The Peale's Bluesky and Mastodon presence, though these platforms may become more relevant as they grow.
Next Steps
This analytics audit sets the foundation for the full website redesign planned for Spring 2026. The insights gathered here will inform information architecture decisions, content strategy, and the design of improved conversion pathways.
